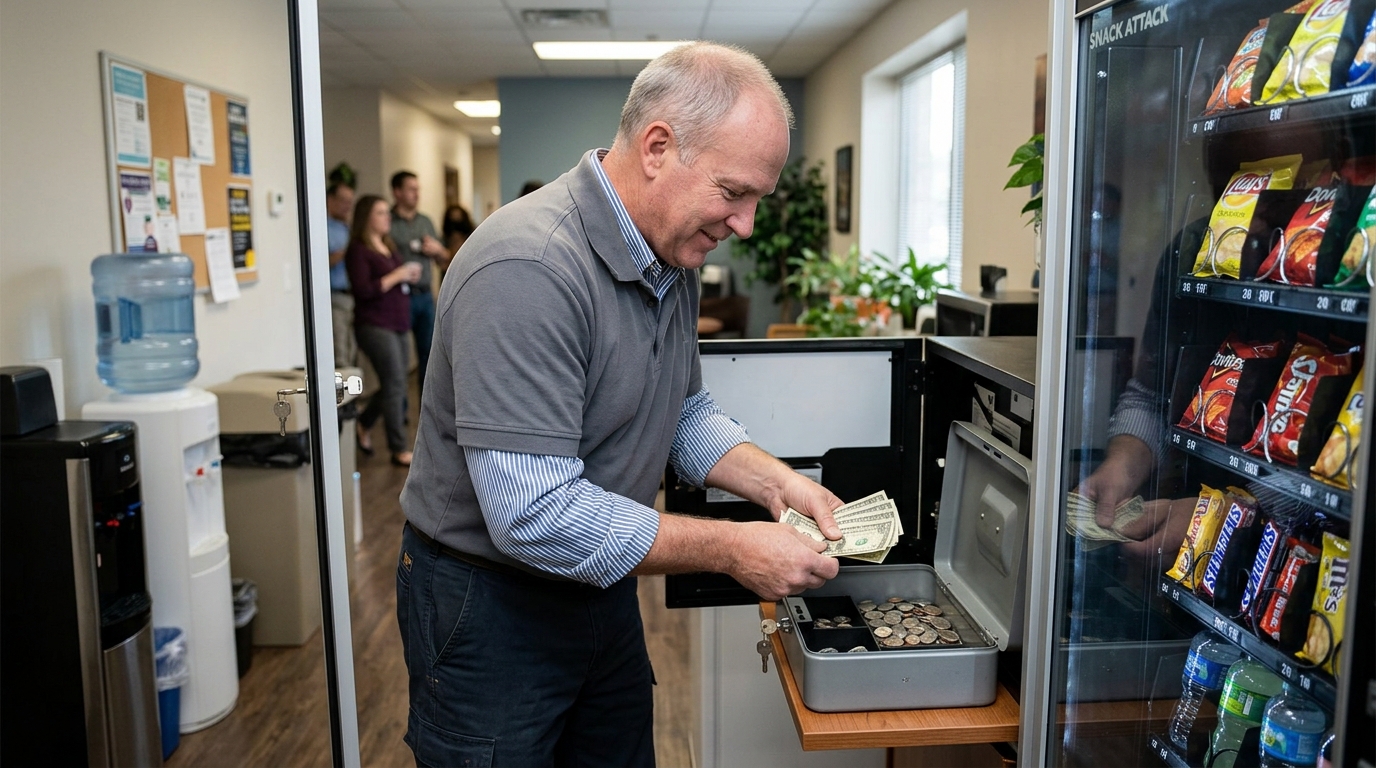
Food Vending Machine Revenue: How Much You Can Realistically Earn
Food vending machine revenue starts becoming meaningful once a single unit clears roughly $2,500 in monthly gross sales, a baseline reachable in a moderately trafficked location once price point and product mix are dialed in. From there, net income depends entirely on cost of goods sold, revenue share paid to the venue, and operating expenses, all of which vary by machine type and placement. This guide builds a full illustrative revenue model from that $2,500 baseline, then shows how the numbers shift across different food vending categories.
About the numbers in this guide: The figures below are an illustrative financial model built from a $2,500 monthly gross sales baseline, not audited industry averages. Actual revenue depends heavily on location traffic, pricing, and product mix, so use this as a planning framework and validate assumptions against your own location’s data.
What Determines Food Vending Machine Revenue
Revenue is a direct function of foot traffic, price point, and how well product mix matches what a location’s visitors actually want to buy, which is why two machines with identical hardware can produce very different sales numbers depending purely on where they sit.
Foot Traffic and Location Type
Higher daily visitor counts create more purchase opportunities, but only when that traffic overlaps with genuine demand for the product category, since a high-traffic location with the wrong audience fit underperforms a moderate-traffic site with strong demand alignment.
Product Category and Price Point
Food vending price points run meaningfully higher than snack vending, typically $4 to $12 per item depending on category, which means fewer total transactions are needed to reach a given revenue target compared to a machine selling $1.50 snacks.
Illustrative Monthly Revenue Example
Using the $2,500 monthly gross sales baseline, an average item price of $5 implies roughly 500 transactions per month, or about 17 sales per day, a realistic pace for a moderately trafficked office or facility location.
Baseline Scenario: $2,500 in Monthly Sales
Working through this baseline against typical food vending cost structure produces the following illustrative breakdown, assuming a 35 percent cost of goods sold, a 15 percent revenue share paid to the venue, and $150 in monthly operating costs covering card processing fees and minor maintenance.
| Line Item | Illustrative Monthly Amount |
|---|---|
| Gross sales | $2,500 |
| Cost of goods sold (35%) | -$875 |
| Gross margin | $1,625 |
| Revenue share to venue (15% of gross) | -$375 |
| Operating costs (processing, minor maintenance) | -$150 |
| Illustrative net profit | $1,100 |
This illustrative $1,100 monthly net profit reflects a single machine at the stated baseline; actual results shift with pricing strategy, negotiated revenue share, and how efficiently restocking and servicing are run.
Revenue Potential by Machine Type
Because price point and capacity vary significantly by category, illustrative gross sales ranges differ accordingly across machine types, even before applying the cost structure above.
| Machine Type | Illustrative Monthly Gross Sales Range | Typical Price Point |
|---|---|---|
| Snack/combo machine | $1,200–$2,000 | $1.50–$3.50 |
| Lunch box/cold food machine | $2,000–$3,200 | $5–$9 |
| Hot food machine (compact/burger-type) | $2,500–$4,200 | $6–$10 |
| Pizza vending machine | $4,000–$7,000 | $8–$14 |
| Ramen/noodle vending machine | $1,800–$3,000 | $4–$7 |
The burger vending machine category illustrates the hot food range well, since its higher price point per item offsets its typically lower transaction volume compared to snack vending. Similarly, the cup noodles vending machine spotted at Venditalia 2026 represents the lower end of the noodle category’s price point, trading a smaller per-item margin for faster transaction speed.
Gross Margin and Cost of Goods Sold
Cost of goods sold in food vending typically runs higher than snack vending because perishable inventory carries more waste risk and shorter shelf life, which is why the 35 percent COGS figure used in this model sits above the 25 to 30 percent range common in shelf-stable snack vending. Machines with higher spoilage risk, particularly cold food and lunch box categories, should budget COGS toward the higher end of that range to account for unsold inventory nearing its pull date.
Revenue Share and Placement Agreement Impact
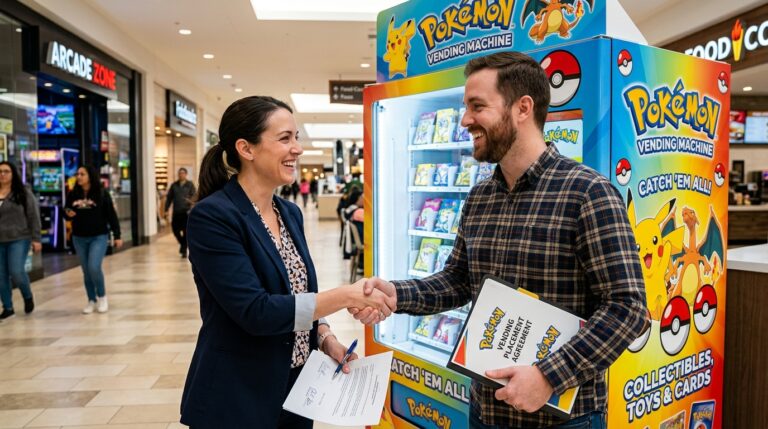
Revenue share terms directly reduce net income and typically fall between 10 and 20 percent of gross sales, meaning the specific percentage negotiated in a placement agreement has a larger effect on take-home profit than most operators initially expect. A location willing to accept a lower revenue share percentage, in exchange for guaranteed installation, can materially outperform a higher-traffic site demanding a larger cut, once the numbers are actually run.
Scaling Revenue Across Multiple Machines
Applying the $1,100 illustrative net profit figure across multiple machines shows how revenue scales with fleet size, assuming each unit performs at the baseline level.
| Number of Machines | Illustrative Monthly Net Profit | Illustrative Annual Net Profit |
|---|---|---|
| 1 machine | $1,100 | $13,200 |
| 3 machines | $3,300 | $39,600 |
| 5 machines | $5,500 | $66,000 |
| 10 machines | $11,000 | $132,000 |
This scaling model assumes each machine independently hits the baseline; in practice, not every location performs identically, and larger fleets typically show a blended result across stronger and weaker sites rather than uniform per-machine output. Finding consistently strong sites at scale is where the best places for a food vending machine becomes a practical reference, alongside how to get locations for a hot food vending machine for operators specifically scaling the higher-revenue hot food category.
Factors That Can Increase or Decrease Revenue
Factors That Increase Revenue
Strong audience-product fit at the location. Cashless payment reducing friction on impulse purchases. Larger machine capacity in genuinely high-traffic sites. Lower negotiated revenue share percentage.
Factors That Decrease Revenue
Location traffic that doesn’t match the product category. High spoilage or waste from mismatched inventory levels. Excessive revenue share cutting into net margin. Frequent stockouts on top-selling items.
Capacity plays a direct role here too; a machine’s footprint and dimensions set the practical ceiling on how much inventory it can carry between restocks, which in turn caps how much revenue a single unit can generate before running empty.
Tax Impact on Net Revenue
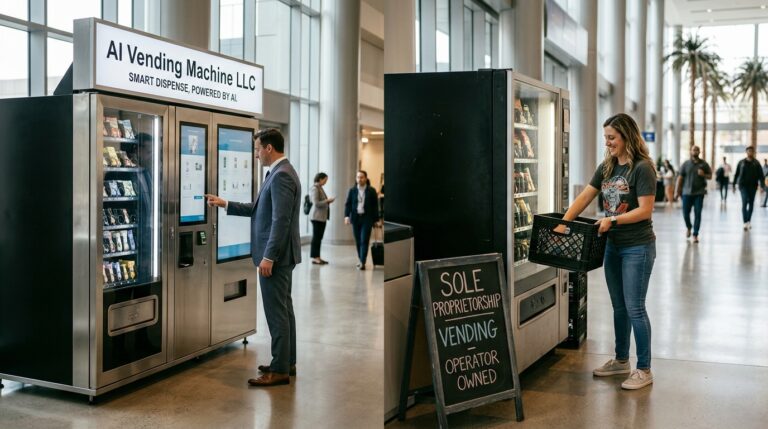
Business structure affects how much of that net profit an operator actually keeps after tax, since a default LLC or sole proprietorship passes all profit through to personal income subject to full self-employment tax, while an S-corporation election can reduce self-employment tax exposure on a portion of profit once income reaches a meaningful level. Many operators still choose to form an LLC for their vending machine business first, for liability protection, before evaluating an S-corp election as revenue scales.
Revenue Potential by Category: Pros and Cons
Higher Revenue, Higher Cost
Pizza and hot food categories show the strongest illustrative revenue range but carry higher equipment and COGS costs.
Moderate Revenue, Lower Complexity
Lunch box and cold food machines balance solid revenue potential against simpler operational requirements than a cooking-capable unit.
Lower Revenue, Lower Risk
Snack and combo machines show the lowest illustrative range but also the lowest spoilage risk and upfront investment.
How to Calculate Your Own Expected Revenue
Start with a realistic daily transaction estimate based on the specific location’s foot traffic, multiply by your planned average price point, and project that across a 30-day month to reach an estimated gross sales figure. From there, apply your actual negotiated revenue share and expected cost of goods sold, rather than the illustrative figures used in this guide, to reach a location-specific net profit estimate before committing capital to a placement.
Where to Learn More
Revenue modeling is one part of a broader business case that also includes startup costs and location strategy; a detailed look at how to start a hot food vending machine business covers the launch side for operators specifically targeting the higher-revenue hot food category, while understanding how a cold food vending machine works is worth reviewing for operators comparing the lunch box category’s operational profile against its revenue potential. Operators without a confirmed location can list space requirements through VPlaced’s location owner matching process to start building toward these revenue figures with a properly matched site.
Buy a Food Vending Machine
Start building toward these revenue numbers with equipment built for reliable, high-volume service.
Buy Food Vending MachineExplore Food Vending Machines by Revenue Category
Compare configurations across the price points and categories covered above.
How much revenue can a food vending machine generate per month?
Using a $2,500 monthly gross sales baseline as an illustrative example, net profit after cost of goods sold, revenue share, and operating costs works out to roughly $1,100 per machine, though actual results vary by location and category.
What’s a typical cost of goods sold percentage for food vending?
Food vending COGS commonly runs around 35 percent of gross sales, higher than the 25 to 30 percent typical in shelf-stable snack vending, largely due to perishable inventory waste risk.
How much revenue share do venues typically take from vending machine sales?
Revenue share commonly falls between 10 and 20 percent of gross sales, with the exact percentage depending on location traffic and negotiating leverage between operator and venue.
Which food vending machine category generates the most revenue?
Pizza vending machines typically show the highest illustrative revenue range due to their higher price point per item, though they also carry higher equipment and cost of goods sold expenses.
Does machine capacity affect how much revenue it can generate?
Yes, a machine’s footprint and slot capacity set the practical ceiling on inventory carried between restocks, which directly caps how much revenue a single unit can generate before running empty.
How does business structure affect how much revenue I actually keep?
A default LLC or sole proprietorship passes all profit through to personal income subject to full self-employment tax, while an S-corporation election can reduce that exposure once income reaches a meaningful level.
How does revenue scale across multiple vending machines?
Revenue scales roughly linearly with fleet size if each machine performs near the baseline, though in practice a mix of stronger and weaker locations typically produces a blended result rather than uniform per-machine output.
What factors most commonly hurt vending machine revenue?
Location traffic that doesn’t match the product category, high spoilage from mismatched inventory levels, excessive revenue share cutting into margin, and frequent stockouts on top sellers all commonly suppress revenue.
How do I calculate expected revenue for my own location?
Estimate realistic daily transactions based on the location’s actual foot traffic, multiply by your planned price point across a 30-day month, then apply your negotiated revenue share and expected cost of goods sold.
Are the revenue figures in vending machine guides always accurate?
No, published revenue figures are typically illustrative models built on stated assumptions rather than audited averages, so actual results should always be validated against a specific location’s real traffic and pricing data.